
A web content graph, part six: The graph database
Over the course of the last five articles I have shown how it is possible to build up an information model (ontology) that can allow narrative Content graph items to link to Content graph authors and to be classified with taxonomy Concepts. I showed how content can flow into a content management system like Drupal by pulling in a structured feed from a source library, and then out to third party applications using a RESTful api. I showed the processes involved in designing and building a taxonomy based on the Simple Knowledge Organisation System (SKOS). I demonstrated how to design and build middleware applications using the cross-platform tool Xojo. I used one such middleware application to retrieve information from these sources via RESTful api methods, to link Content graph items with Content graph authors, to classify Content graph items using taxonomy Concepts and finally to serialise the linked data using RDF information in N-triples format.
- Guiding principles for content graphs
- Content design for content graphs
- Taxonomy design for content graphs
- Middleware design for linking information
- Information model design for content graphs
- Using a graph database to tie everything together (this article)
- Managing a graph database using the api
There is still one major piece to bring into the content graph. That is, identifying a place to store the RDF information that I have generated. For this purpose, I'm using a graph database, and that is the subject of this article.
In this article
Overview of GraphDB ^
GraphDB is an industry-leading enterprise-level graph database system built by Ontotext. It is a commercial product, but for this work I used the freeware version (v10.8).
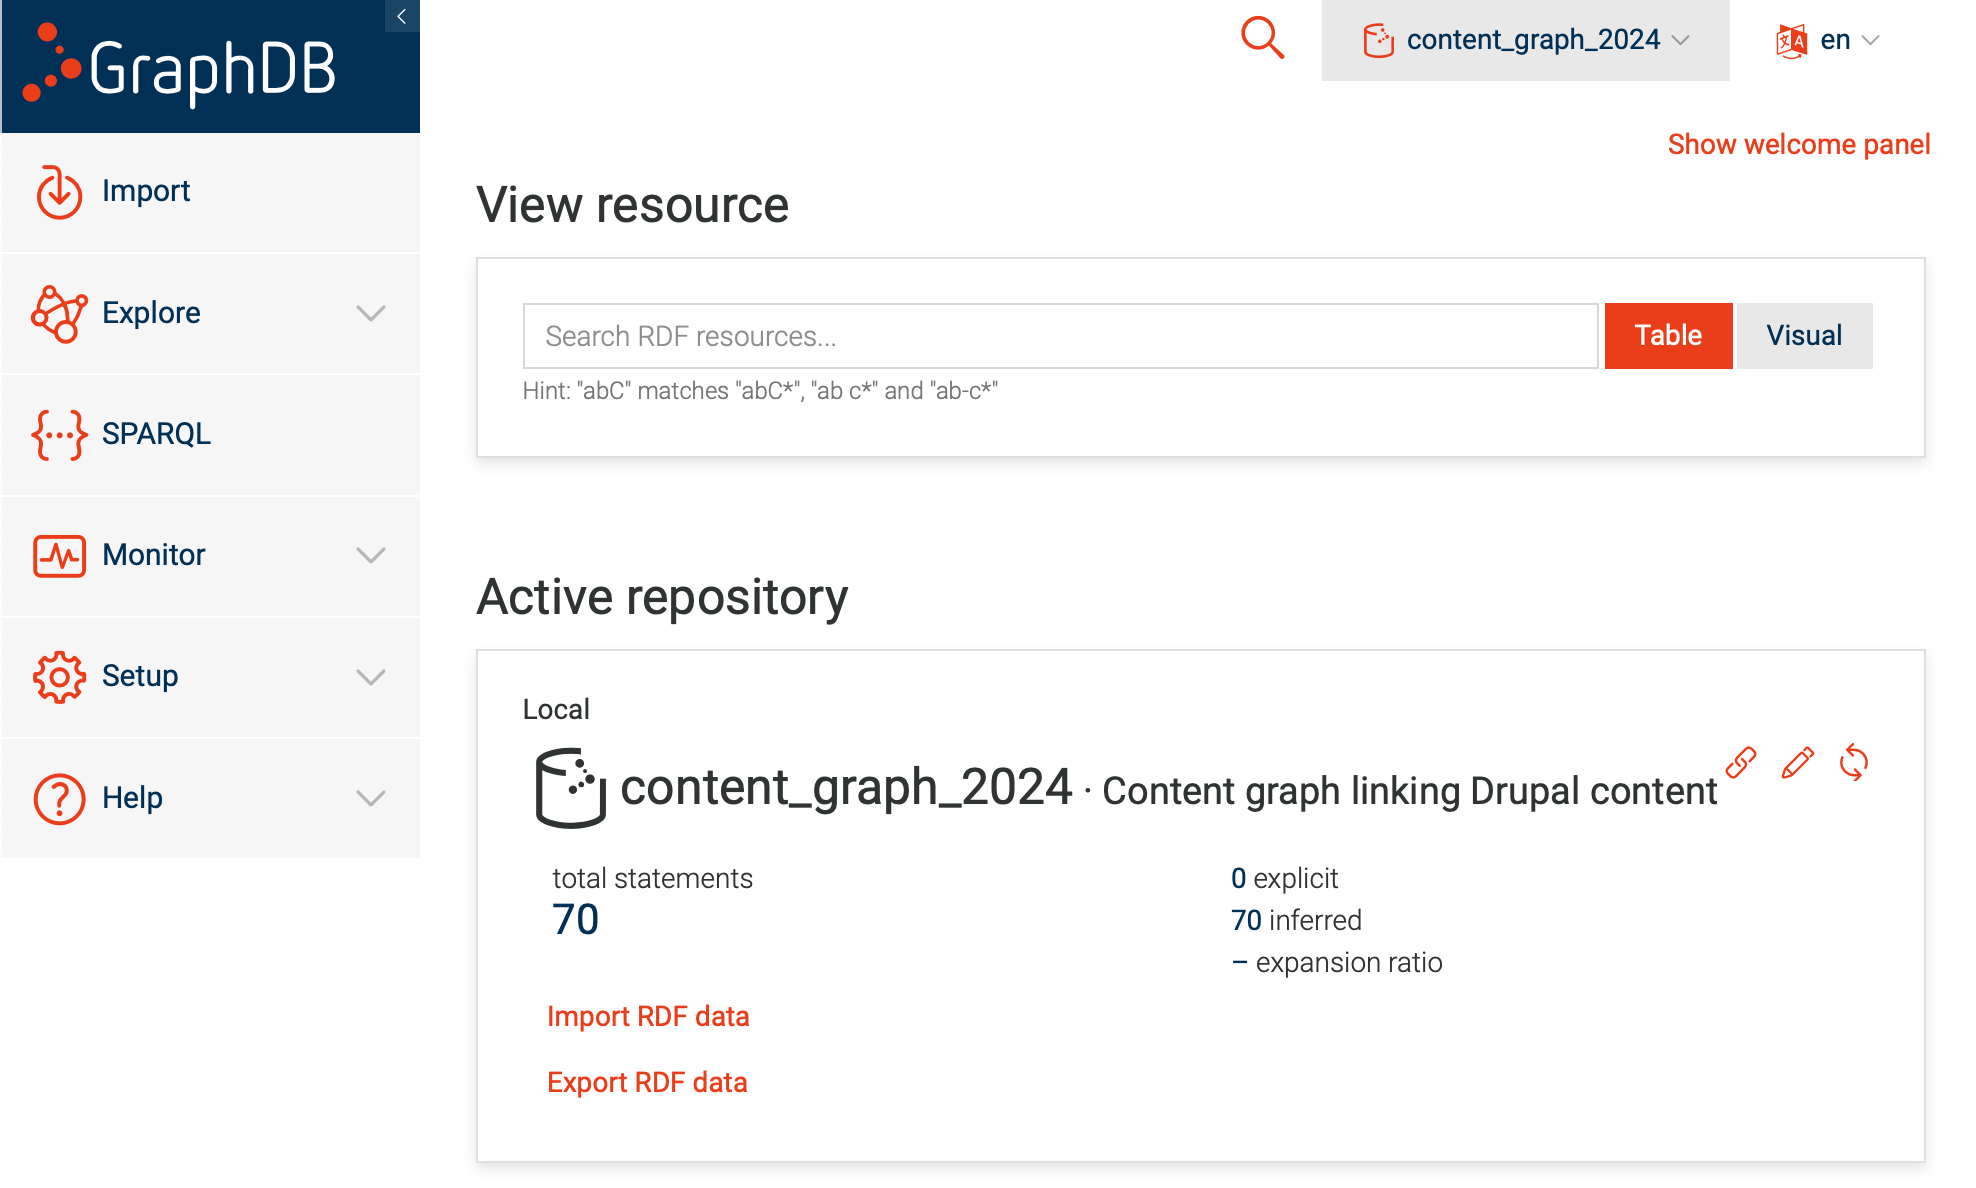
GraphDB allows the user to set up graph repositories, which in simple terms are managed collections of triples (see article four where I produced a collection of triples). In common with most enterprise-grade software, GraphDB does much more, but I'm going to focus in this article on just a few features.
Importing triples data into GraphDB ^
I first had to get a collection of triples. In part four I showed a middleware application that created triples both for linking Content graph items with Content graph authors and for classifying Content graph items with taxonomy Concepts. For this article I used a small subset of Content graph items (10 in all) and ran through the classification process using the middleware program. I wrote the 150 or so triples that resulted from these processes out to a text file in N-triples format. This is a very small sample of the results to illustrate the structure, colour-coded in the usual way.
<https://content.tellurasemantics.com/Content-graph/Content-graph-item/0709.2989v1> <https://content.tellurasemantics.com/Content-graph/hasAuthor> <https://content.tellurasemantics.com/content-graph/content-graph-person/29614> .
<https://content.tellurasemantics.com/content-graph/content-graph-person/29614> <https://content.tellurasemantics.com/Content-graph/AuthorOf> <https://content.tellurasemantics.com/Content-graph/Content-graph-item/0709.2989v1> .
<https://content.tellurasemantics.com/Content-graph/Content-graph-item/0709.2989v1> <https://content.tellurasemantics.com/Content-graph/hasSubject> <https://vocabulary.tellurasemantics.com/TelluraContentGraph/e8a73b39-21fa-49b4-a590-4d550459631c> .
<https://vocabulary.tellurasemantics.com/TelluraContentGraph/e8a73b39-21fa-49b4-a590-4d550459631c> <https://content.tellurasemantics.com/Content-graph/subjectOf> <https://content.tellurasemantics.com/Content-graph/Content-graph-item/0709.2989v1> .
Each line in the N-triples file conforms to the same structure, which will no doubt be familiar by now:
[Subject URI] [Predicate URI] [Object URI] .
So the sample above shows the inverse relations between, first, a Content graph item and a Content graph author, and second, between a Content graph item and a taxonomy Concept.
First I will show how to import these triples from a file into a repository in GraphDB. Then I will show how to explore this using both SPARQL queries and a visual graph.
In the GraphDB interface I chose the Import option. This showed an interface that allowed me to choose an import file.
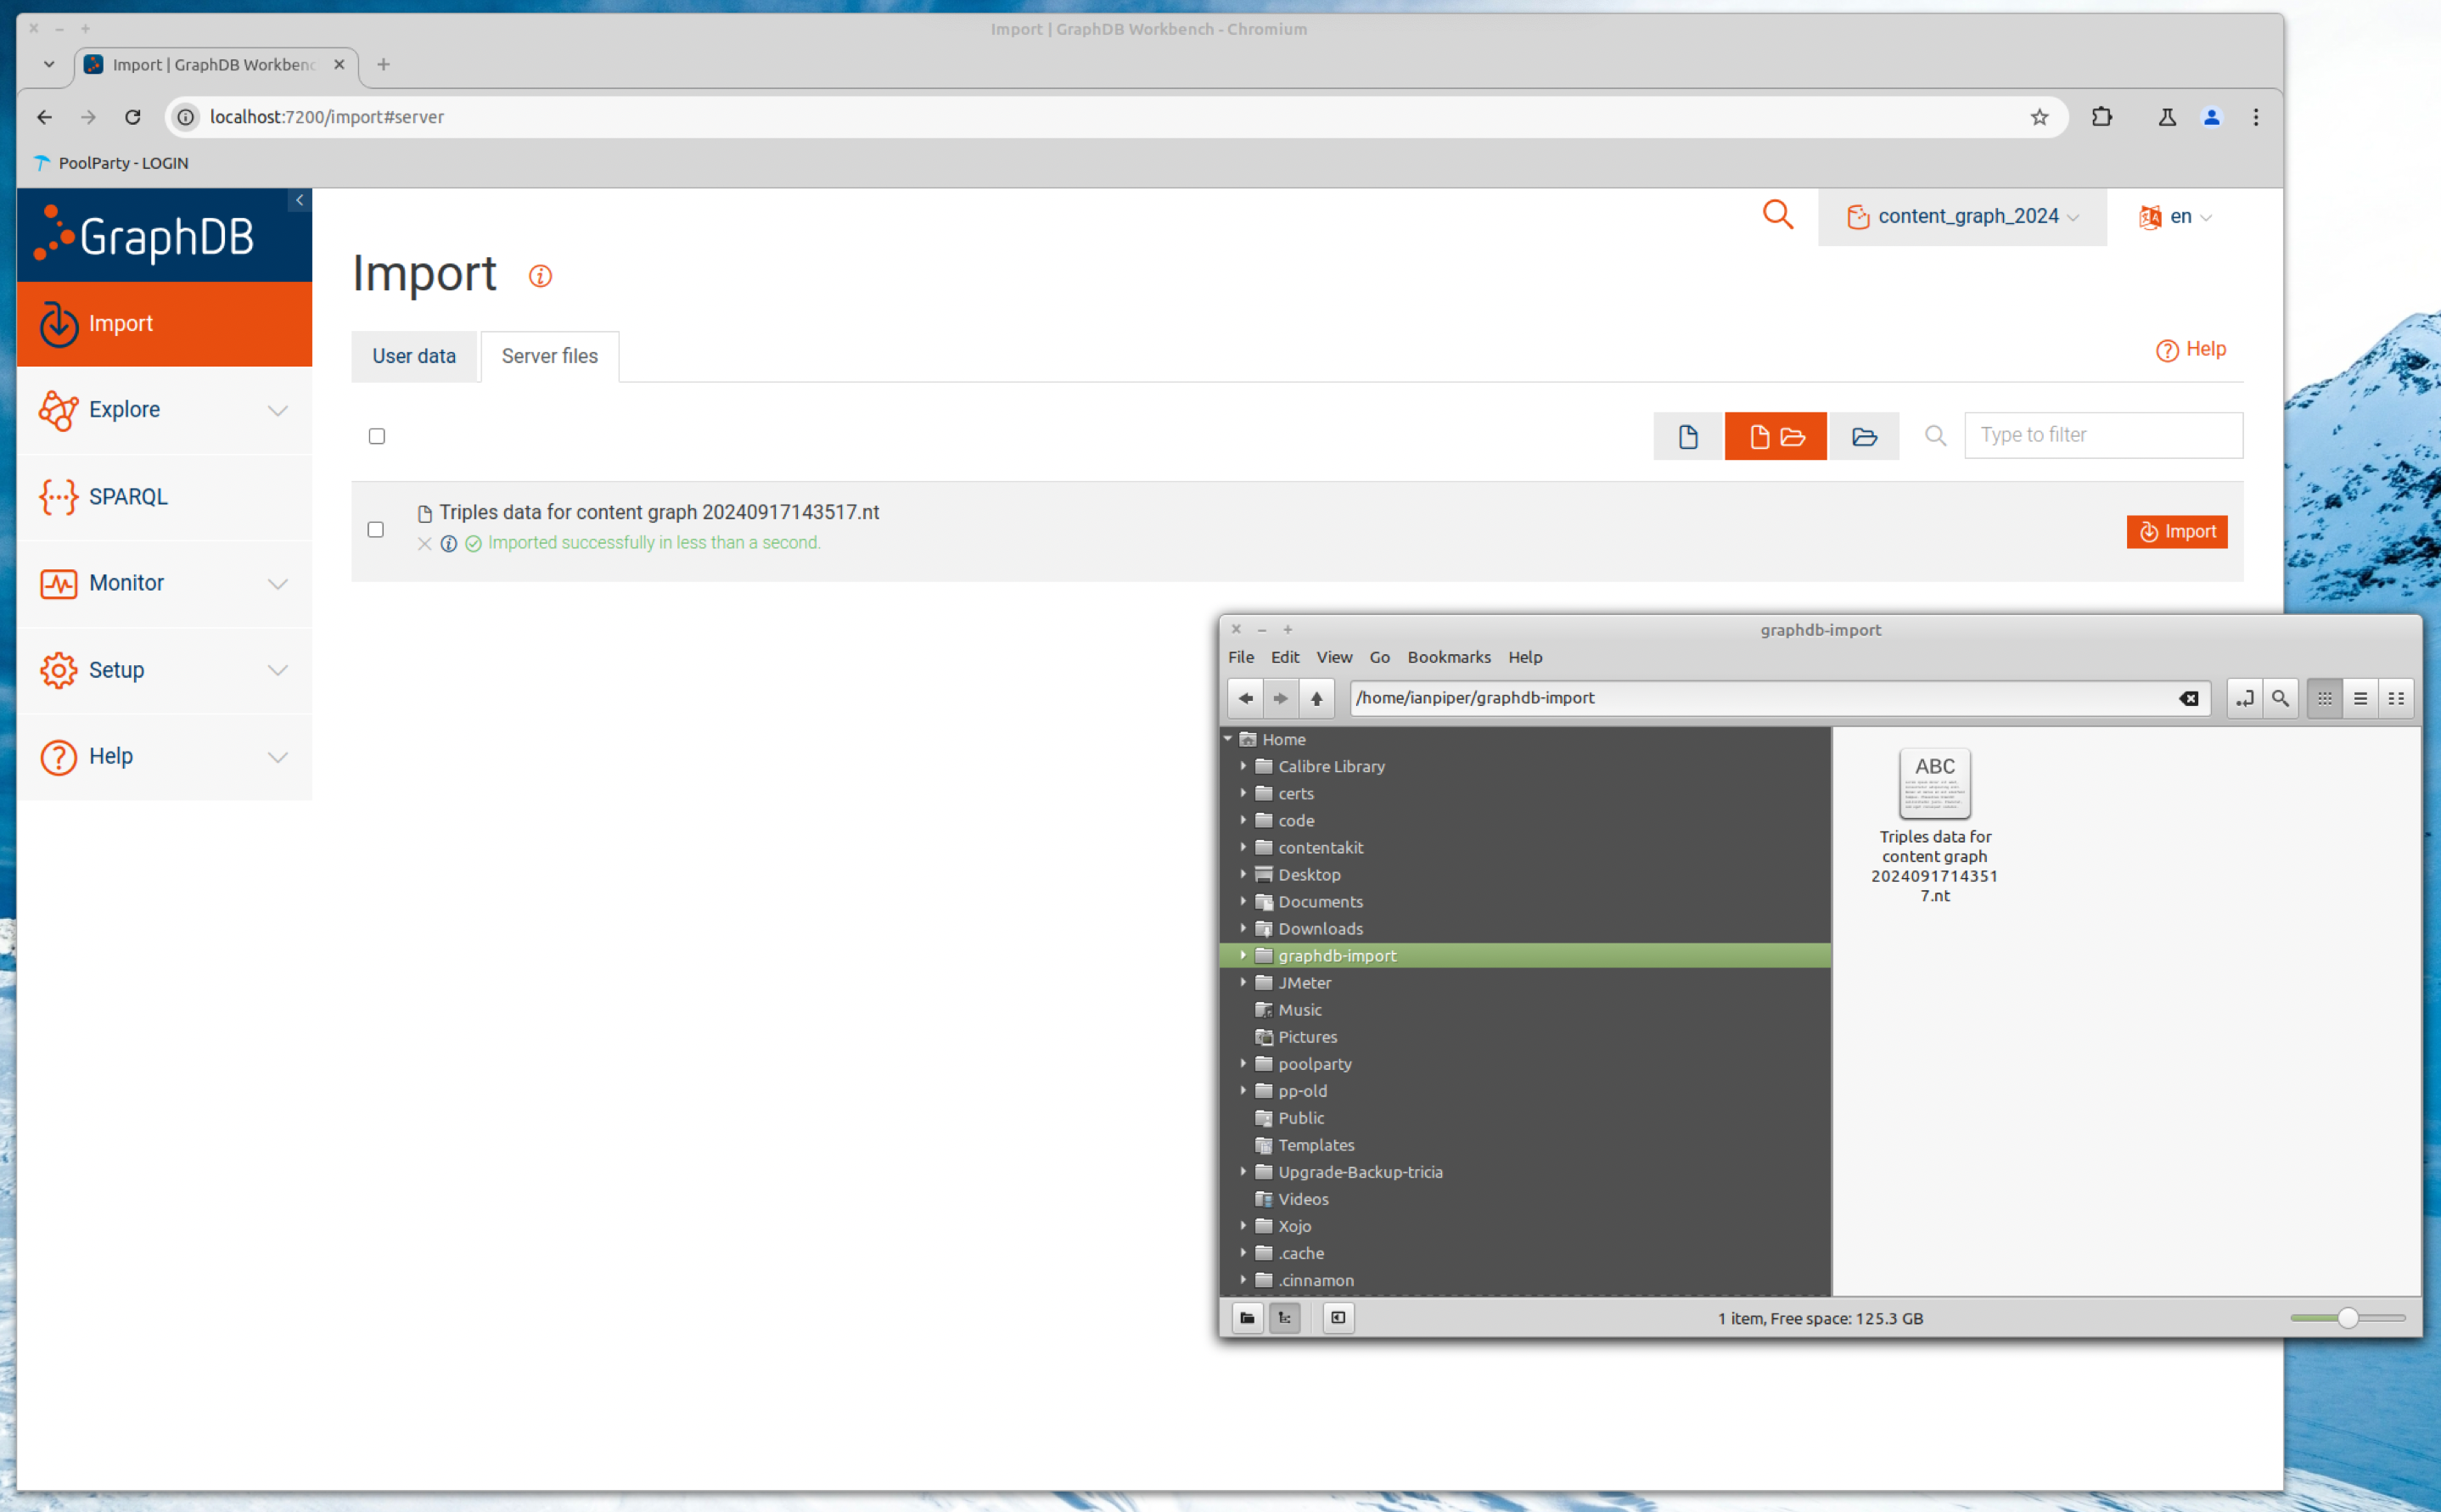
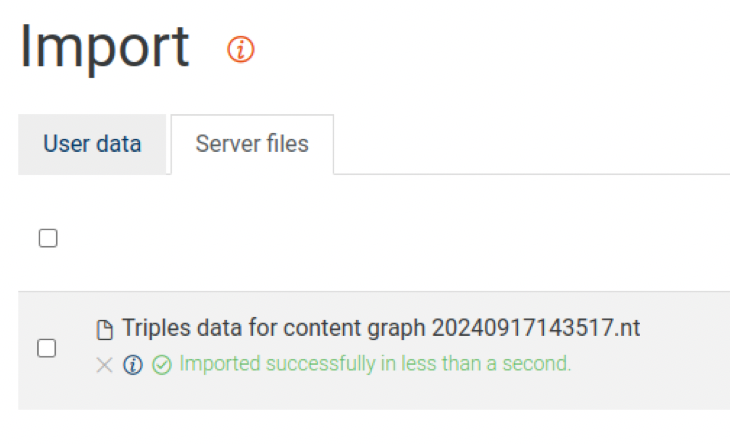
The user interface shown above may be unfamiliar to many. The GraphDB instance that I'm using here is running on a Linux computer. In the screenshot above you will see that there is a file manager window showing the N-triples file in the relevant import folder. To start the import I simply checked the box for the import file and clicked the Import button. The UI is a little terse, but you can see the message in green confirming a successful import. Here is a closer view.
Once imported I moved to the Graphs overview menu and chose The default graph.
A caveat and apology ^
I'm conscious that this is only part of what would be involved in seamlessly moving triples information from my middleware program to GraphDB. I have two excuses:
- I'm still comparatively new to using the GraphDB api. It should (and will) be possible to link the content graph middleware program to GraphDB via the api and save the effort of saving triples data out at one end and importing it at the other. I'll cover this in the next article.
- I have to consider the possibility of my audience running out of interest. Describing a file import takes less time and text than describing the details of my middleware interacting with another api, and I'm already at risk of turning this set of articles into a book!
For now, let's get back to exploring GraphDB.
Exploring the graph in the tabular view ^
Tabular view is the most common display in GraphDB and shows a table-like layout with one triple per row and columns for the subject, predicate and object. This is a convenient way to quickly move up and down the graph view.
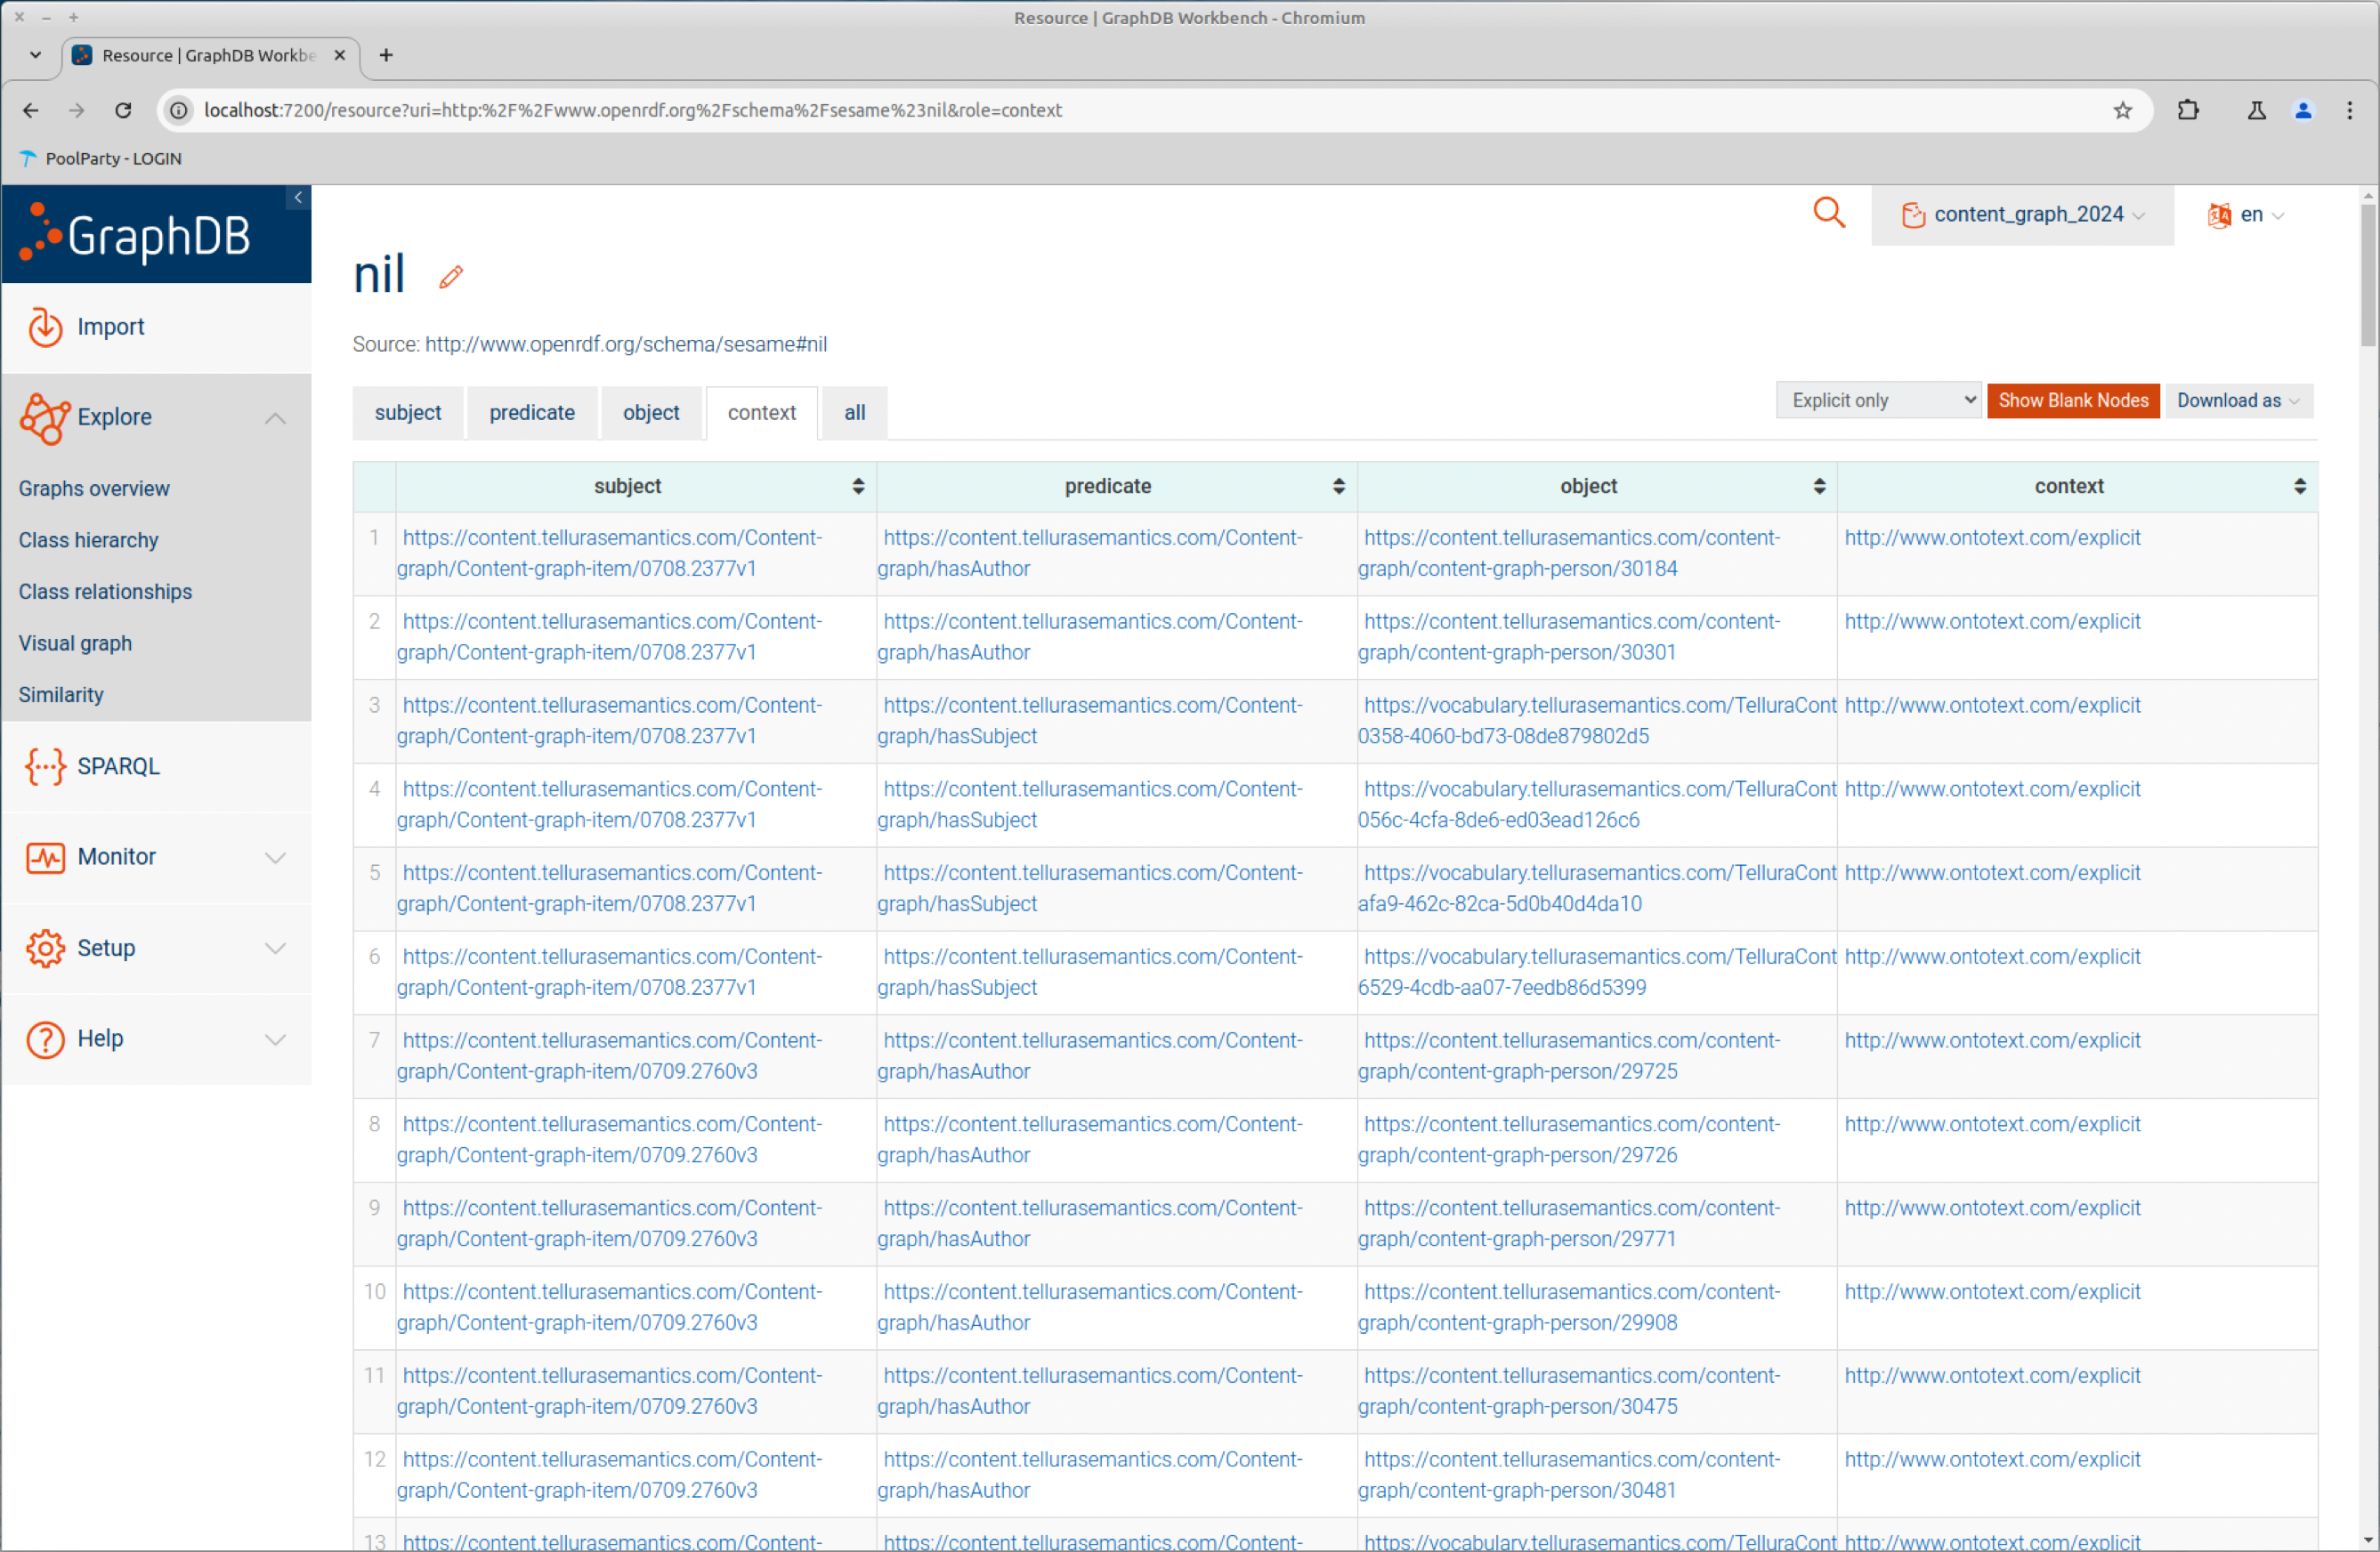
You can also drill into any of the components by clicking on it. Here I've chosen the subject in the first triple (https://content.tellurasemantics.com/Content-graph/Content-graph-item/0708.2377v1) (you can't follow this link). The view changes to show a subset of the graph containing that subject with all of its predicates and objects.
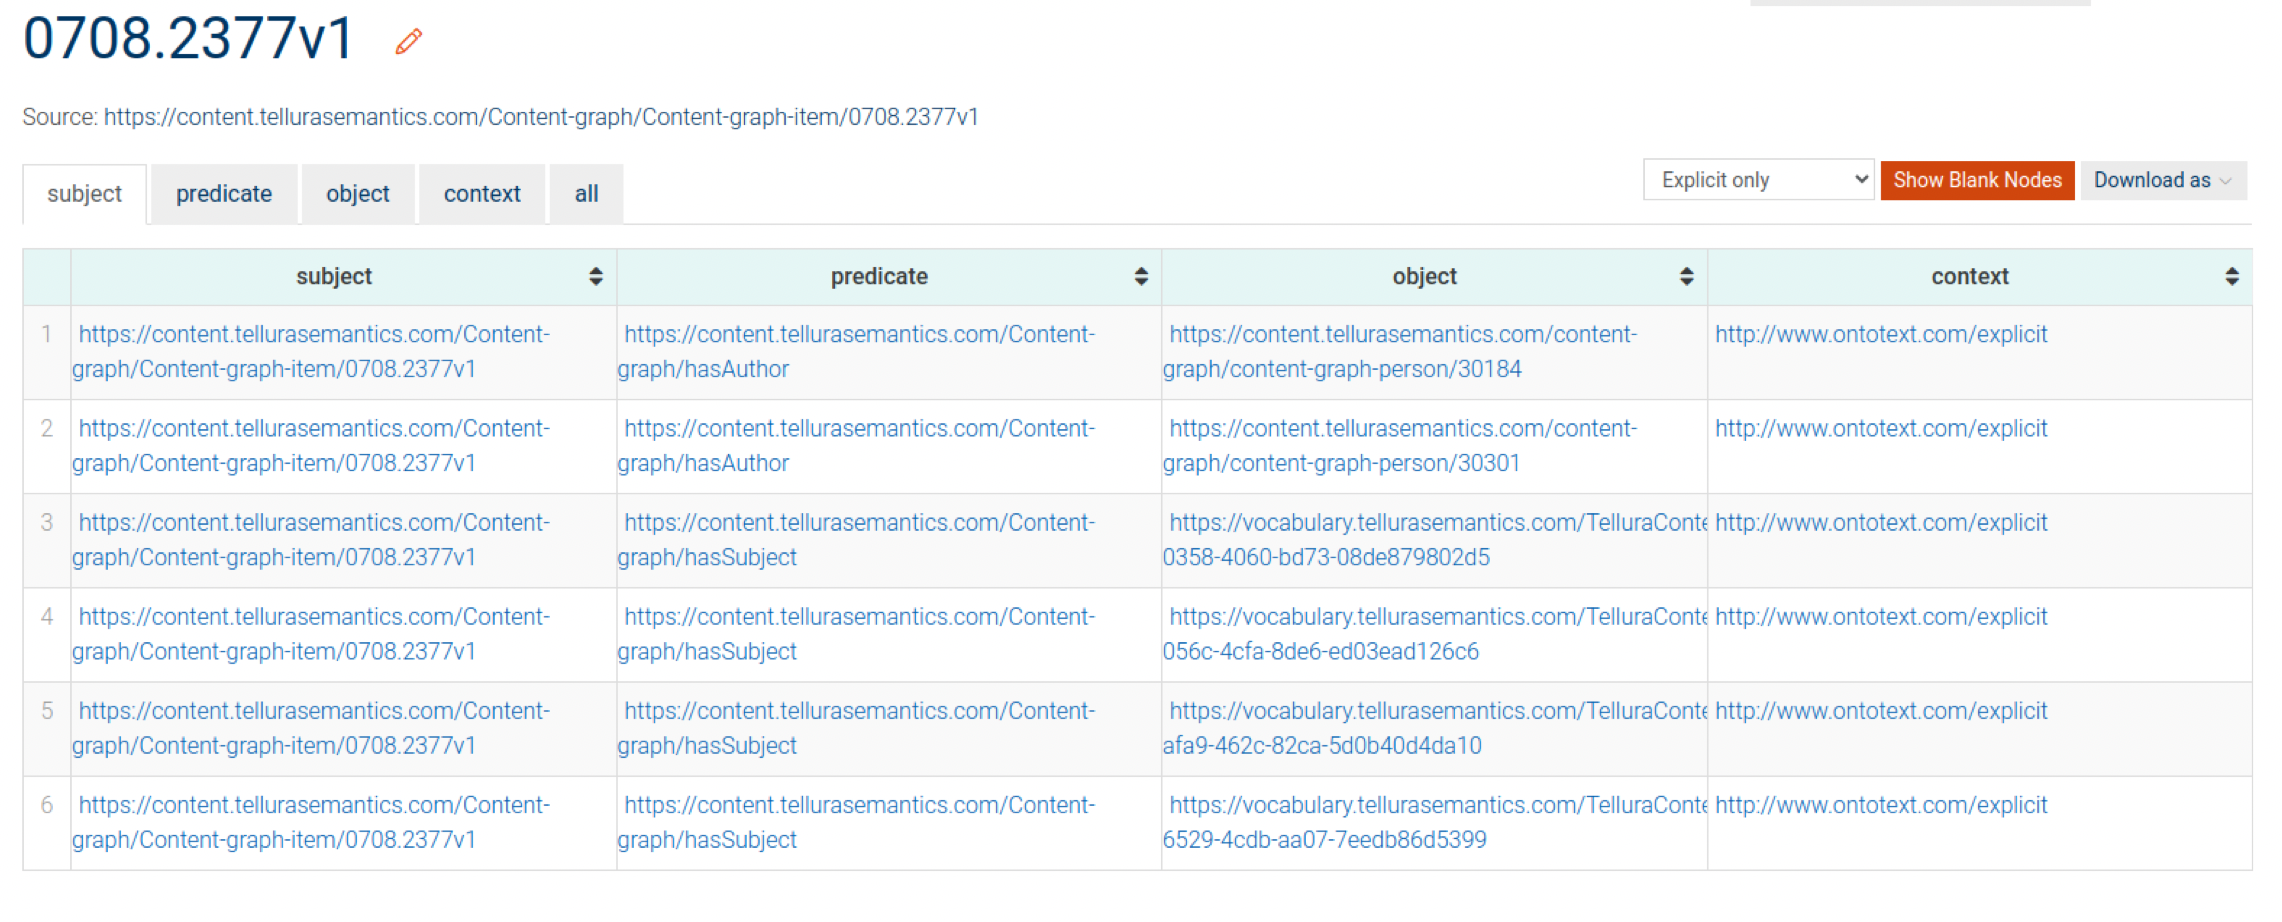
Aside: only hasAuthor, not authorOf? ^
In the tabular view you will notice that only one half of the inverse pair of triples is shown. Don't worry, both halves are implicitly there in the graph. I assume that only one half is displayed for space reasons (bear in mind that a graph may contain millions or billions of triples, which would take up more visual space if they were explicitly shown).
Exploring the graph using SPARQL ^
Using the SPARQL query language is central to using GraphDB. It is possible to use many functions without SPARQL, but it's hard to avoid. So let's take a look.
The SPARQL menu shows a fairly simple interface; an editor and a set of results.
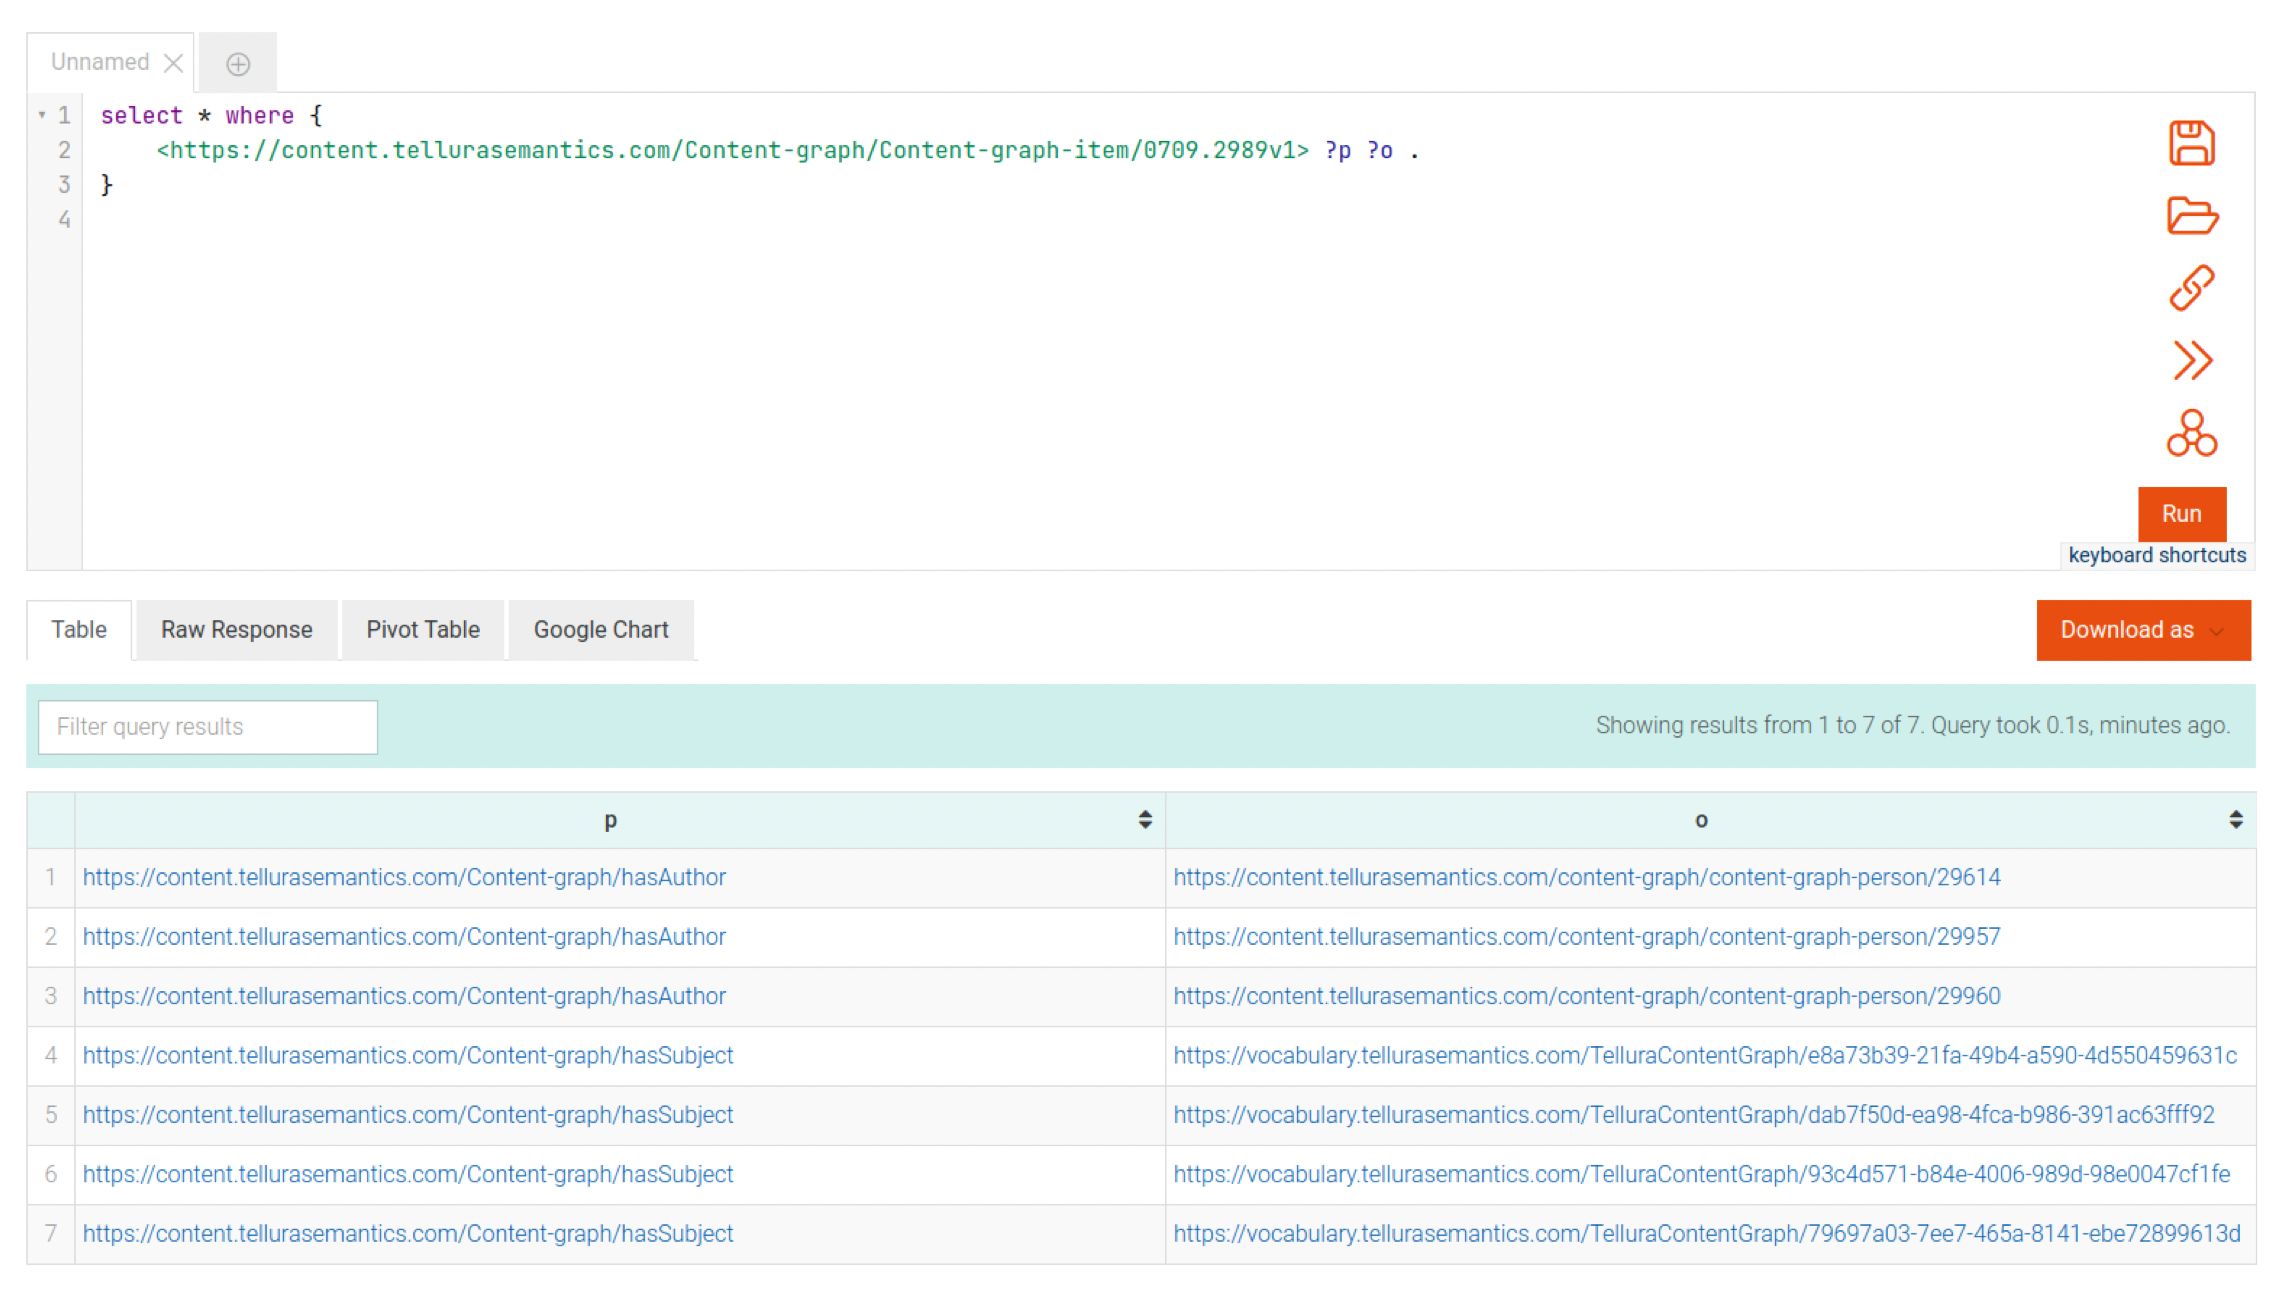
In this figure I have written a simple query, similar to the implicit query that I created above by clicking on the subject:
select * where {
    <https://content.tellurasemantics.com/Content-graph/Content-graph-item/0709.2989v1> ?p ?o .
}
Let's break this query down.
All SPARQL queries take the general form
[select stuff]
[condition]
[Triple that I want to explore]
- Select * means choose all triples (that match what comes next).
- Add URIs in each part of the triple that I want to fix (in this case, I want to fix the subject.
- Use ?p (for predicate) and ?o (for object) to indicate that I want to retrieve all of these that match the fixed URI from above.
- Terminate the query with a dot (".").
This is more or less the simplest form of a SPARQL query; they can get much more sophisticated!
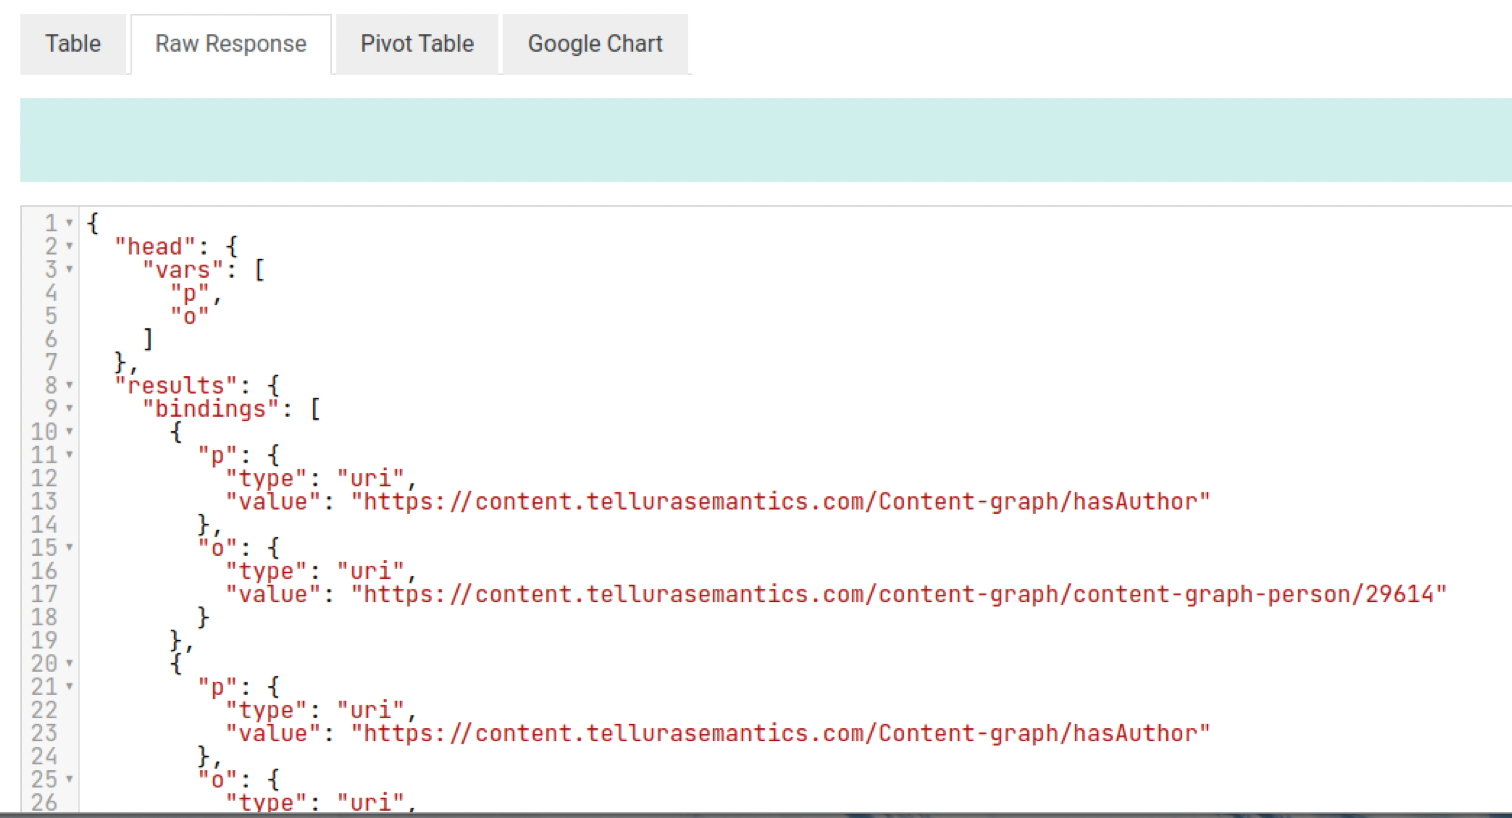
In addition to the tabular presentation it is also possible to display raw data in JSON format:
You can also create a Google Chart display (a more conventional spreadsheet view) and there are options for constructing pivot tables that I do not begin to understand. Another exercise for the reader, I'm afraid.
Exploring the graph visually ^
To me, one of the biggest potential benefits of a graph-based approach to information management is that it lends itself naturally to graphical (by which I mean pictorial) representation.
Let's jump straight in and see how this works. One of the options under the Explore menu is Visual graph:
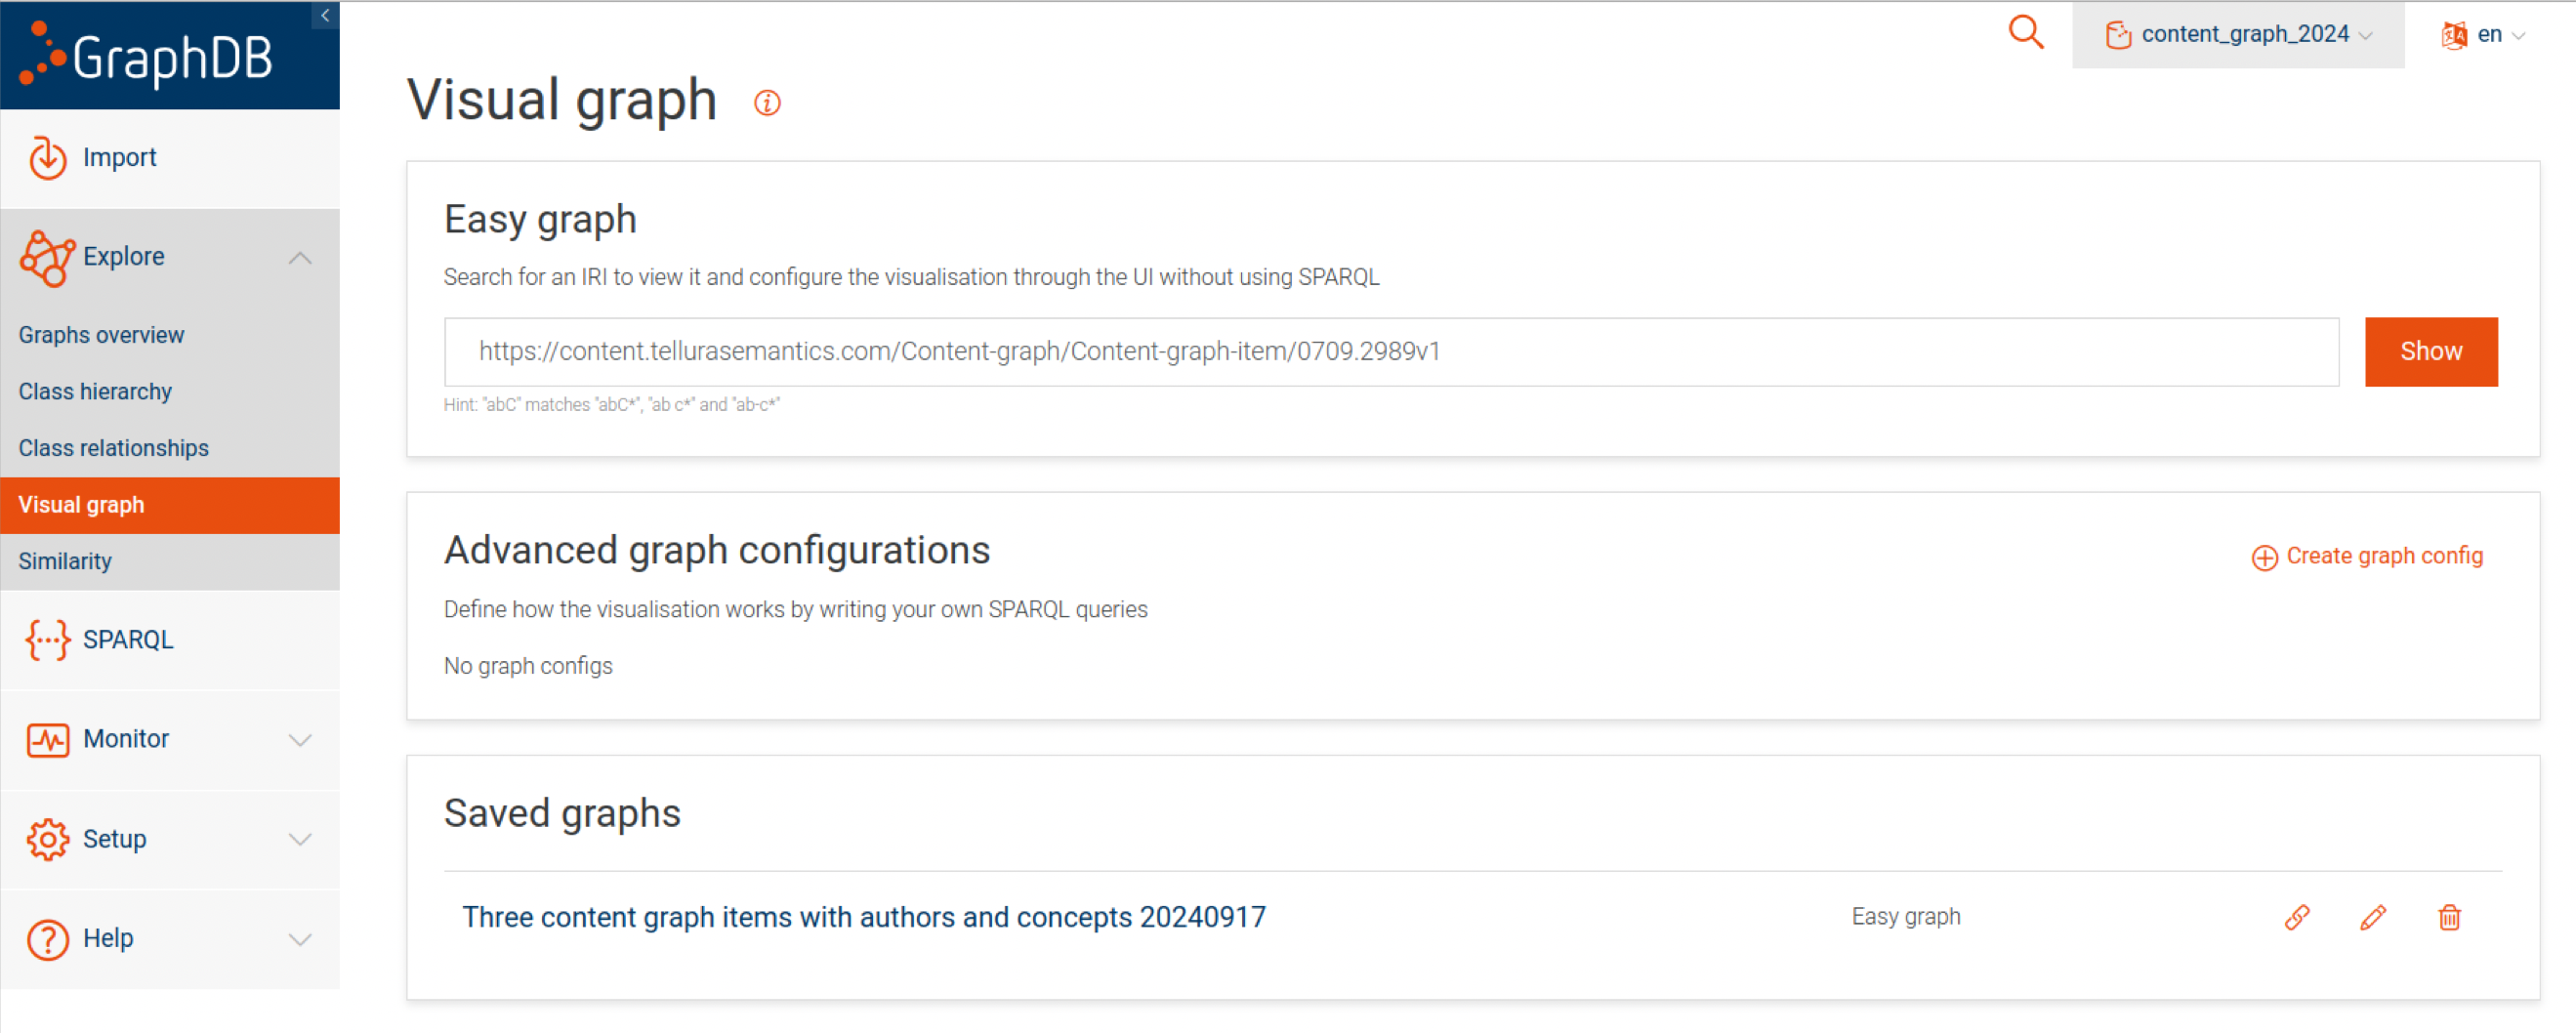
Let's create a graph using the Easy graph method. Simply write a URI for a resource into the form and click Show.
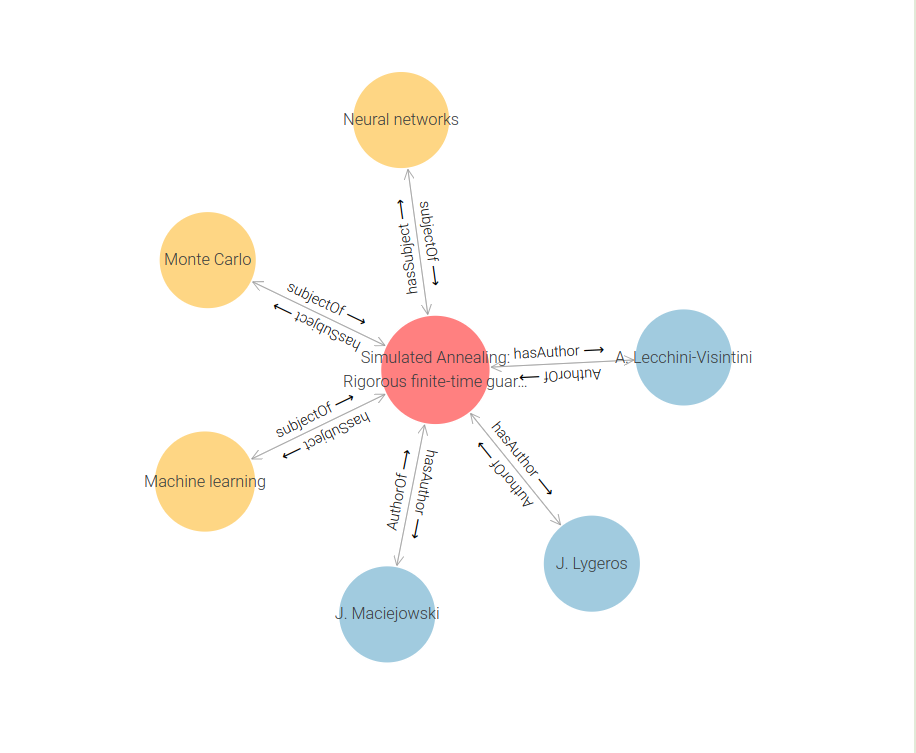
The result shows the specified content item in the middle, and linked to it are all of the things to which it has relations. Notice that the labels on the objects are displayed, not just the URIs (you can see the URI by hovering over an object or clicking on it to bring up the information panel). If the objects in the graph have rdf:type properties then they will be colour-coded. By the way; I mentioned earlier that although the tabular form only shows, for example, hasAuthor, the graph also stores authorOf. You can see those inverse relations in this diagram.
If I hover over one of these nodes, I see a floating menu providing further button options for this node. The one I'm interested in here is the Expand button:
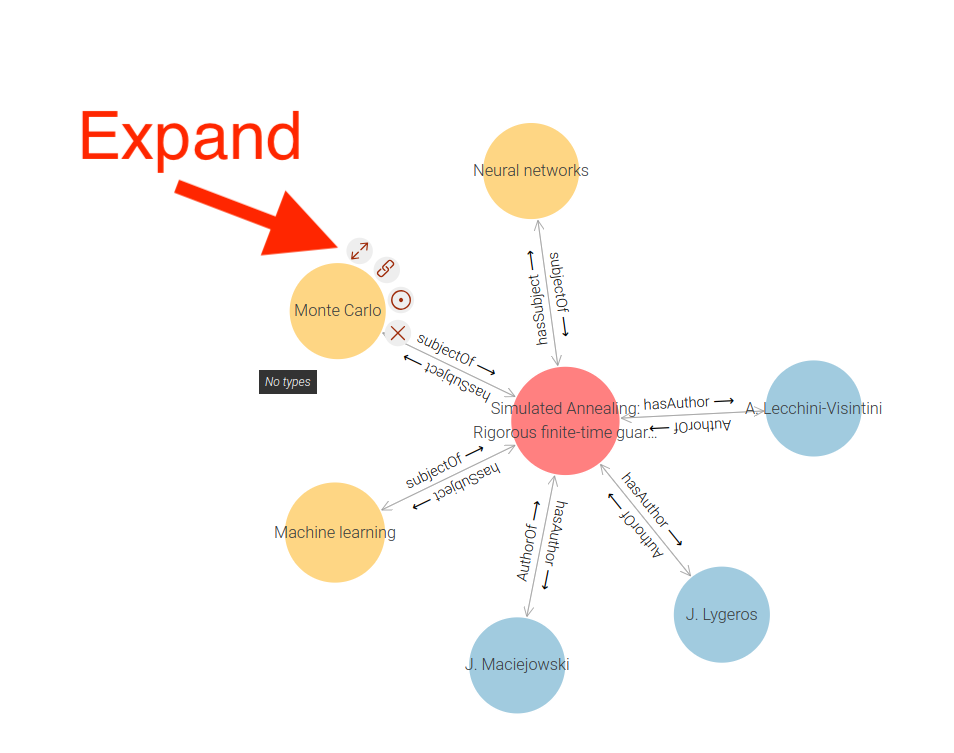
Clicking this causes the displayed graph to expand to include resources linked to this node:
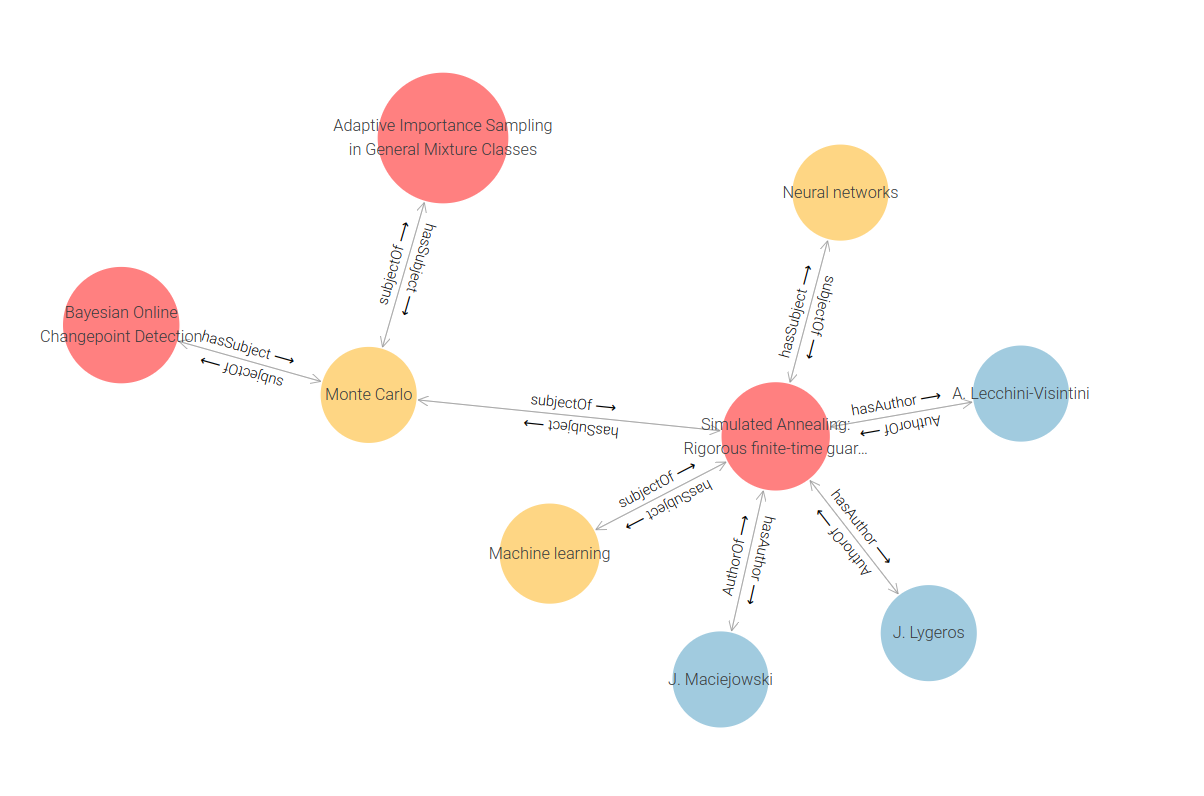
So there are two other content items that have been tagged with Monte Carlo. Continuing to elaborate using the Expand button on different objects gives a larger visual graph, like this.
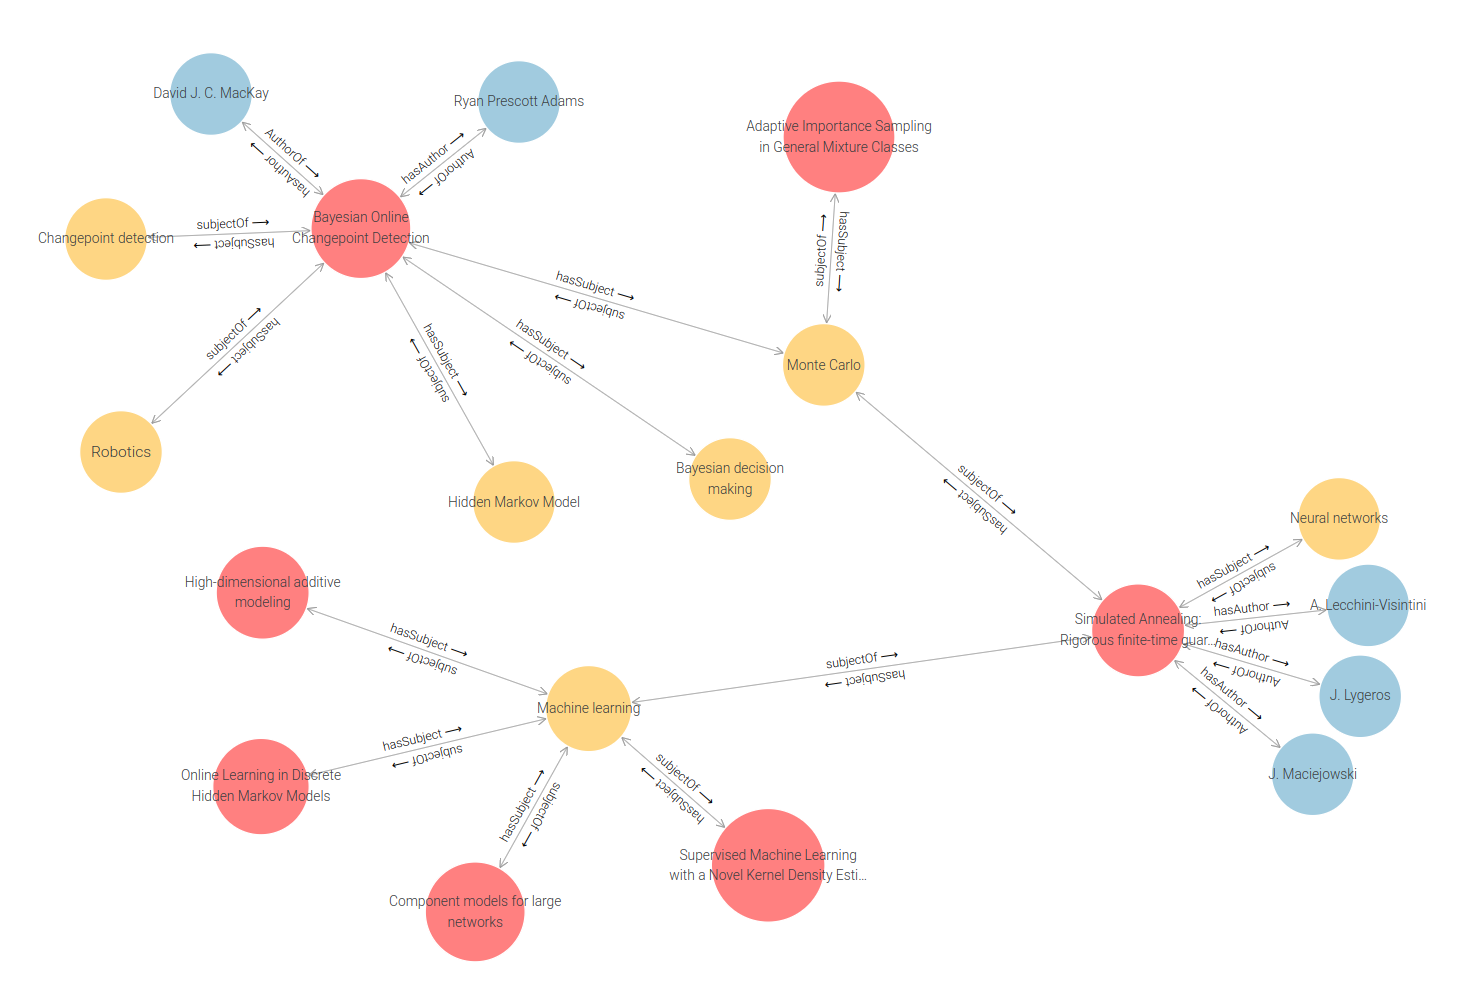
In fact you can expand this graph in any direction from any node, as long as it has a relation to another object. Even in a very limited graph like this there are some interesting links emerging; it is possible to see similarities between content items. In a larger graph it is likely that people who have authored multiple content items would emerge.
In conclusion ^
I have completed almost all that I originally set out to do:
- I designed and built a content source that manages items and authors with structured content types.
- I designed and executed RESTful api methods that allowed a structured export of the content information.
- I designed, built and enriched a SKOS-based taxonomy of concepts that are tailored to the content source created earlier.
- I designed and built a semantic middleware application that is able to consume the RESTful information from the content source and the taxonomy.
- I used the middleware program to match content items to content authors and also to find plausible concepts with which I could tag the content items. I used this middleware to create a set of semantic triples that (for now) are serialised as N-triples text information.
- I showed how to import N-triples information created above into the graph database system GraphDB. I showed how to create a visual representation of the content graph that is capable of being analysed for useful insight and of being explored using visual tools to find new linked information.
Still, we don't yet have a complete landscape. The main missing piece is to show how to populate the content graph in the graph database by using the GraphDB api. That's coming up in the next article.
If you have had enough stamina and interest to make it this far on this journey, I hope you have found it interesting and potentially useful.